May 11, 2021 |
James Messi
Fibonacci retracement levels are derived from the sequence of numbers, made famous by Leonardo Fibonacci more than 700 years ago, called the Fibonacci sequence.
The sequence starts with 0 and 1. From there, the sum of the previous two numbers determines the next number in the sequence. For example, the beginning of the sequence looks like 0, 1, 1, 2, 3, 5, 8, 13, 21, 34, and 55.
The retracement levels (0%, 23.6%, 38.2%, 61.8%, 78.6%, and 100%) are taken from ratios that can be created from numbers in the Fibonacci sequence. For example, dividing 13 by 34 gives you 38.2%. Dividing 34 by 55 gives you 61.8%. And so on.
Many of the world’s top traders and investors utilize Fibonacci retracement levels to find relevant price points on a chart. These points are used to predict where a price’s trend may be paused or reversed. In this article, you’ll gain an actionable understanding of what Fibonacci retracement levels are and how you can deploy them as an indicator in your overall crypto analysis.
What are Fibonacci Retracement Levels?
Fibonacci retracement levels are represented as horizontal lines on a chart. The set of lines are placed between two points of interest on a chart. Typically a range that is created from a high and low price point.
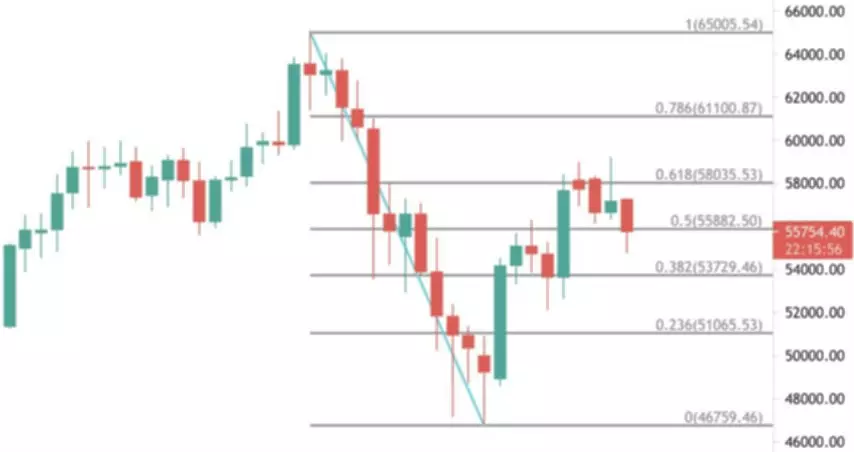
In the example bitcoin BTC-USD chart above, the range is set between the local high of 65005.54 and the local low of 46759.46. The lines range from 0 (0%) to 1 (100%). This means that the low price of 46759.46 represents a 0% retracement in price movement. If the price went back to the top of the range at 65006.54, it will have made a 100% retracement of the move from 65005.54 down to 46759.46.
With the exception of 0.5, each line corresponds to a Fibonacci ratios (0%, 23.6%, 38.2%, 61.8%, 78.6%, and 100%). These are the percentages that price would move, within the defined range. For example, the range above starts at 65005.54 and ends at the base point of 46759.46. The next Fibonacci level above our base point is at 51065.53 (0.236), this is the 0.236 line because the price would increase by 23.6% of the range if it moved from the base point of 46759.46 to 51065.53. Put differently, the specified range (46759.46 to 65005.54) represents a price move of 18246.08. Going from the 0 line to the 0.236 line (46759.46 to 51065.53) is a 4306.07 price move. Dividing 4306.07 by 18246.08 gives you 0.236 or 23.6%.
Using Fibonacci Retracement Levels in Techincal Analysis
In technical analysis, Fibonacci retracement levels are used by stock, foreign exchange, commodity, and cryptocurrency traders to determine where a trend in price may pause or begin to reverse.
The Fibonacci levels are often thought of as marking significant levels in the market. For this reason, traders also use Fibonacci retracement levels to find areas of support and resistance which also indicate where a trend is slowing down or reversing.
When adding Fibonacci retracement lines to a chart in an uptrend, the highest price should sit at the 0 (0%) line, and the lowest price at the 1 (100%) line. In this case, a full retracement requires a move from the high price back down to the low price. When charting an asset in a downward trend, set the lowest price at the 0 (0%) line and the highest price at the 1 (100%) line.
Ultimately, the insights gained from analyzing the Fibonacci retracement levels should be paired with a confirming indicator, such as the relative strength index (RSI) which measures strength or weakness as a function of buying or selling volume.
The combination of price hitting a Fibonacci level, paired with a confirming indicator such as the RSI, can help traders enter and exit trades at better prices and with more confidence. This combination can also used to help you determine where your stop-loss order should be placed.
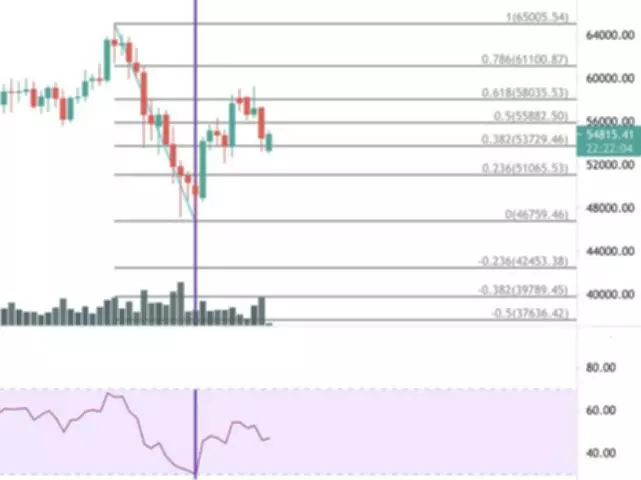
In the example chart above, a 1-day RSI has been added as a confirming indicator. In this example of a BTC-USD 1-Day chart, we are using the retracement lines to find the best price to enter a trade. The candle on the purple line wicks perfectly to the 0 (0%) line making a full retracement from the highs at 65005.54.
On its own, this may not tell us much, but we can also see that the RSI became oversold at the same time. The market became oversold at that point, which suggests that sellers have become exhausted, providing a higher likelihood of a pause or reversal in the downtrend.
Summary
Fibonacci retracement levels are used by professional traders and analysts to determine price levels that are likely to signal a suspension or reversal in a trend.
The Fibonacci lines are applied from a high to a low point on a chart, or vice versa, and range from 0% to 100%, with Fibonacci ratios added in between.
Fibonacci retracement levels are not a fool-proof method and should always be used in conjunction with a confirming indicator such as the relative strength index (RSI), volume, or exponential moving average (EMA).
To plot a Fibonacci retracement onto a chart in a downtrend, start at the high price and drag your centerline to the low price. To add the retracement to a chart in an uptrend, start at the low price and drag the centerline to the highest price point.